The dynamics of epidemics and pandemics are not the usual stuff of everyday conversations, but COVID-19 has changed much in our lives and is clearly destined to change much more. Many nations are now in the throes of dealing with its swift advance, but how well are the differing national approaches to COVID-19 containment performing?
Initial efforts to curb its spread focused on border controls, but community-based transmission, rather than infected travellers, has required a strategy shift (1, 2). Efforts are now centred on reducing person-to-person contact to limit the chances of transmission, although the daily growth of new cases demonstrates that controlling its spread within and across communities is a difficult task (3).
The difficulties in controlling COVID-19 are due to several factors. Its incubation period is relatively long, some five to six days and longer for some. Those who are infected become infectious, and infect others, before they display any symptoms or become aware that they have the disease (4). There is also evidently a significant fraction of cases who remain asymptomatic (5, 6). They never develop symptoms, but they still infect others.
Certain parameters characterise the virus itself, and our understanding of their settings is improving at a rapid pace (7). These include its incubation period, or the time between contracting the infection and the appearance of symptoms, and its virulence, or the severity of its health effects. Other parameters, like the reproduction number (related to infectiousness), or the number of new infections each case typically generates, and case fatality, the number of infected people that die from the infection, describe its macroscopic behaviour in real communities.
Several online dashboards (8, 9) now provide daily updates of COVID-19 positive cases for nearly all countries. While the data have some significant inconsistencies, particularly related to differences in testing regimes, i.e., whether there is widespread, proactive testing as was seen in the Republic of Korea, or restrictive testing according to qualifying criteria as in Australia, the message is clear. COVID-19 infections, like many other viruses, grow exponentially. This is a simple statement, but to understand its meaning and implications requires closer examination.
Fixed rate exponential growth means that the number of cases doubles in a defined amount of time. If there are 100 cases on day-1, and the doubling period is five days (the estimated doubling period of the early coronavirus outbreak in China) then on day-6 (five days later) there will be approximately 200 cases, and on day-11 (another five days later), there will be 400 cases, and so on. This is exponential growth, with a longer doubling period representing slower growth compared to a shorter doubling period. The doubling time is dynamic and informs us of the impact (or lack of impact) of interventions on epidemic growth.
When ministers or commentators talk about ‘flattening the curve’, they mean lengthening the doubling period. Flattening the curve, or slowing the rate of growth of new infections, is crucial to the maintenance of capacity in the health sector (quite apart from the economic and social impacts of a nation under severe stress). A failure to moderate growth of infections rapidly overwhelms any nation’s health systems, demanding a switch to emergency settings where decisions must be made as to who is most deserving of scarce health resources (10, 11), leaving many without help.
Flattening the curve, or increasing the doubling period is achieved through official policies and social behaviours. These range from simple social distancing practices (as recently introduced in the USA, UK and Australia), through to more aggressive approaches involving the cessation of all non-essential activities, and the expectation (or perhaps enforcement) of stay-at-home policies (as seen in China and Italy). Reducing the opportunity for transmission of infections aims to lower the growth rate. The doubling period therefore reflects the integrated effects of national policies and behaviours. Changes in the doubling period reflect policy effectiveness.
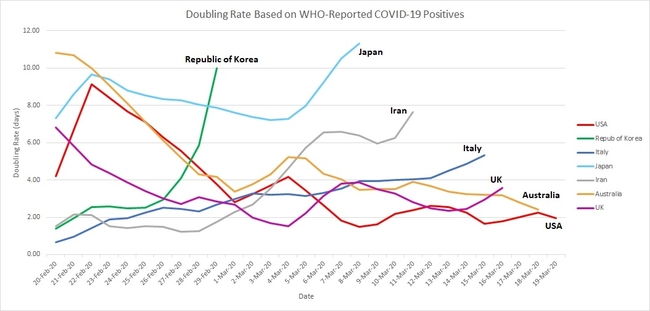
Figure 1 shows the doubling period as it has changed during the month to 19th March 2020, for seven nations. Before describing the observed behaviours and their implications, a few words are in order on how this graphic was produced.
Doubling Rates of WHO-Reported Covid-19 Cases
Using the World Health Organization’s Novel Coronavirus Situation dashboard (8), a spreadsheet of daily case numbers was collated for these (and other) nations. For each nation, the number of positives (say, Nd) on any given day (say, Day(n)) was then compared with numbers on following days, until the number exceeded 2 x Nd, say, on Day(n+6). Interpolating linearly between Day(n+5) and Day(n+6) generated the decimal number of days taken to double Nd. The process was then stepped forward starting at Day(n+1), to find how many days were required to double that number of COVID-19 cases, repeating through the dataset.
In the early days of virus appearance in many countries the number of positives was small, and often this number did not change for many days. In Australia reported cases remained at 15 for two weeks. When cases subsequently reached 30, the doubling period could be calculated, but stepping forward day-by-day generated a doubling period that was shorter by one day for each step, until the starting point was no longer 15. This is why the trajectory for Australia in Figure 1 shows a steady decline from 22-February to 28 February. It is also the reason Figure 1 starts on 20 February rather than a month earlier, because the small, invariant case numbers in each country produced uninformative variability before then, except for China.
The data from WHO database suffer other inconsistencies. For example, it was very common to see a value repeated on two successive days followed by an unusually large jump the following day, reflecting reporting delays and surges. For this reason, the data were smoothed using a three-point moving average filter. This has the effect of reducing large daily swings and gives a stronger sense of trends.
One further comment is warranted on data treatment in Figure 1, in order to explain why some of the trajectories end before 19 March 2020. If the number of cases on a given day has not yet doubled, a doubling period cannot be calculated. For example, Japan had 568 cases on 11th March. As at 23rd March this number has not doubled so the trace ends. The smoothing filter also has the effect of removing the last two data points, so the final valid doubling period for Japan was calculated on 8th March. Similarly, the last valid data point for the Republic of Korea (RoK) was on 29th February.
Given that a large doubling period represents much slower growth, it is clear that the Republic of Korea (RoK) and Japan have managed to achieve stronger control of infections than the other nations shown. In fact, China reached 42,700 cases on 11th February, and this number has not yet doubled, which is why China does not appear in Figure 1. Its doubling period, according to this method has extended to many weeks (12).
To illustrate the large effect of differences in doubling periods, compare numbers between Japan and Italy. On 23rd February, Italy reported 132 cases, and Japan reported 144: virtually the same. Although Japan’s doubling period was close to eight days, Italy’s was initially less than one day. Infections in Italy were therefore doubling at many times the rate of those in Japan. Eight days later, Italy reported 1,700 cases, to Japan’s 254. As at 23rd March, Italy reports more than 50 times the number in Japan, at nearly 60,000 cases to Japan’s 1,089.
The Republic of Korea (RoK) adopted a proactive COVID-19 testing regime to identify the many pre-symptomatic and asymptomatic people responsible for unknowingly spreading the infection (13). Once identified, this program was backed up with a strong policy of isolation that allowed the infections to run their course (with hospital interventions where needed), which had the effect of largely halting new infections. The approach has isolated the core of infectious individuals from the community, effectively resetting the clock to a much earlier time (low numbers), which allows RoK to resume contact tracing and less restrictive measures to contain further spread. RoK’s policy approach was informed by China’s methods, although China was reported to have taken a much more aggressive approach. Nevertheless, China now reports very slow growth, and now sees days with no new infections in Hubei Province.
While Italy became the new COVID-19 epicentre through the past month, it has managed to adopt policies and behaviours that have seen a steady rise in the doubling period since then. The UK, USA and Australia, by contrast, have seen rapid growth in cases with sustained low doubling periods. Both the United States and Australia are still on a downward path towards accelerating growth of infections, similar to the rates that saw Italy suffer an avalanche of infections that is at least partially responsible for a higher case fatality rate of about 8%, many times higher than other nations (cf, RoK at approximately 1%). This may reflect the ageing population of Italy, or under-ascertainment of the denominator.
Figure 1 shows that, by monitoring doubling periods in almost real time, we can understand the very different outcomes in infection growth rates for each nation. The method provides a simple way to visualise the gross effects of national containment policies and shows the stark differences between the outcomes in RoK and Japan, and perhaps Italy (14), compared with the way that the USA, UK and Australia are currently tracking.
1. Cohen & Kupferschmidt, 2020, Strategies Shift As Coronavirus Pandemic Looms, Science, 367, pp962-963.
2. Ferguson et al, 2020, Impact of Non-Pharmaceutical Interventions (NPIs) to Reduce COVID-19 Mortality and Healthcare Demand, Imperial College COVID-19 Response Team, 16 March 2020, https://www.imperial.ac.uk/media/imperial-college/medicine/sph/ide/gida-fellowships/Imperial-College-COVID19-NPI-modelling-16-03-2020.pdf
3. Pueyo, T., 2020, Coronavirus: The Hammer and The Dance, Medium.com, https://medium.com/@tomaspueyo/coronavirus-the-hammer-and-the-dance-be9337092b56
4. Heymann & Shindo, 2020, COVID-19: What is Next For Public Health?, The Lancet, 395(10224), pp542-545.
5. Mizumoto et al,2020, Estimating the Asymptomatic Proportion of 2019 Novel Coronavirus onboard the Princess Cruises Ship, medRxiv 2020.02.20.20025866; doi: https://doi.org/10.1101/2020.02.20.20025866
6. Nishiura et al, The Rate of Underascertainment of Novel Coronavirus (2019-nCoV) Infection, J Clinical Medecine, 9(2), 419.
7. Del Rio & Malani, 2020, Covid-19 – New Insights on a Rapidly Changing Epidemic, J American Medical Association, February 28, doi:10.1001/jama.2020.3072
8. World Health Organization, Novel Coronavirus (COVID-19) Situation, https://who.maps.arcgis.com/apps/opsdashboard/index.html#/c88e37cfc43b4ed3baf977d77e4a0667
9. Johns Hopkins University, Coronavirus COVID-19 Global Cases, https://gisanddata.maps.arcgis.com/apps/opsdashboard/index.html#/bda7594740fd40299423467b48e9ecf6
10. Nunes-Vaz et al, 2019, Imperatives for Health Sector Decision-Support Modelling, Intl J of Disaster Risk Reduction, 38, https://doi.org/10.1016/j.ijdrr.2019.101234
11. Daniel Sokol, 2020, The Life and Death Decisions of COVID-19, TheBMJOpinion, British Medical Journal, 20 March 2020, https://blogs.bmj.com/bmj/2020/03/20/daniel-sokol-the-life-and-death-decisions-of-covid-19/
12. Kupferschmidt & Cohen, Can China’s COVID-19 Strategy Work Elsewhere?, Science, 367, pp1061-1062
13. Balilla, J., 2020, Assessment of COVID-19 Mass Testing: The Case of South Korea, March 18, 2020. Available at SSRN: https://ssrn.com/abstract=3556346 or http://dx.doi.org/10.2139/ssrn.3556346
14. Day, M., 2020, Covid-19: Identifying and Isolating Asymptomatic People Helped Eliminate Virus in Italian Village, British Medical Journal, 368, BMJ 2020;368:m1165.